Voyager Remote
Color Coding
Throughout the Setup workspace, Voyager uses color to indicate the following:
- Black: A normal setting
- Gold or Yellow: Use caution when changing as things may not work well or as expected
- Red: Use extreme care when changing this setting - the wrong value can damage your equipment or the imaging session may fail
Voyager Remote Workspace
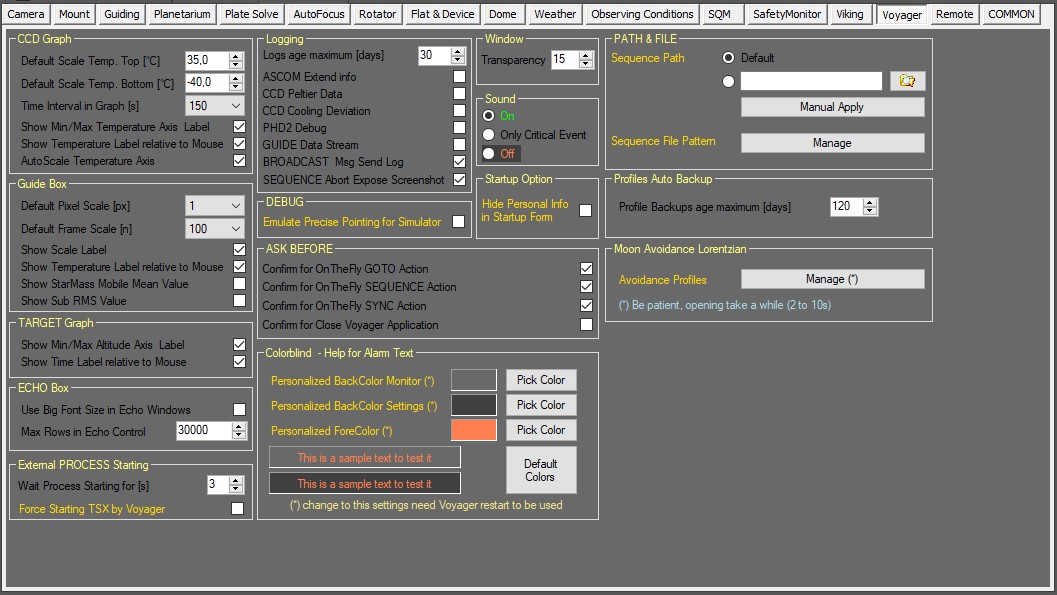
Click the Voyager button in the Setup workspace to display the Voyager settings window, which contains miscellaneous settings about Voyager's operation:
CCD Graph
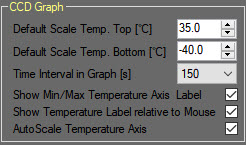
The CCD Graph panel of the Voyager setup workspace contains parameters for the CCD Widget displayed in the Status Window
- Default Scale Temp. Top (°C): Default value for the top of the temperature scale, in °C
- Default Scale Temp. Bottom (°C): Default value for the bottom of the temperature scale, in °C
- Timer Interval in Graph: Total time represented by the X axis of the graph in seconds
- Show Min/Max Temperature Axis Label: If checked, display the white boxes with the values represented by the top and bottom of the Y axis (temperature) of the CCD Widget displayed in the Status Window
- Show Temperature Label relative to Mouse: If checked, hovering the mouse shows the temperature of the point under the mouse cursor in the CCD Widget displayed in the Status Window
- AutoScale Temperature Axis: If checked, automatically scale the values of the top and bottom of the Y axis (temperature) of the CCD Widget displayed in the Status Window so the displayed values fit in the widget
Guide Box
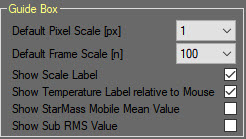
The Guide Box panel of the Voyager setup workspace contains parameters for the Guide Widget displayed in the Status Window:
- Default Pixel Scale: The number selected from the drop-down box represents the number of pixels, +/-, represented by the Y axis scale of the Guide Widget displayed in the Status Window. For example, a value of 1 here means the top of the graph represents a guide error of +1 pixels, and the bottom of the graph represents a guide error of -1 pixels
- Default Frame Scale: The number of guiding frames (exposures) represented by the X axis of the graph
- Show Scale Label: If checked, the values of Default Pixel Scale and Default Frame Scale are displayed in white boxes at the top and bottom respectively of the Guide Widget displayed in the Status Window
- Show Temperature Label relative to Mouse: If checked, when the mouse is hovered over the Guide Widget displayed in the Status Window, a white box pops up over the graph and shows the temperature represented by the mouse pointer location
- Show StarMass Mobile Mean Value: If checked, the moving average of the StarMass value is displayed in the Guide Widget displayed in the Status Window
- Show Sub RMS Value: If checked, the RMS value of the current guide exposure is displayed in the Guide Widget displayed in the Status Window


