Status Window
Status Window
On the right side of the main window there is a column that can display either a configurable selection of status widgets, or a configurable set of command widgets:
At the top of the status window, you will find controls that let you configure the window itself:
- Show Synoptic View: Show the most recently saved arrangement of the status widgets
- Save Synoptic View: Save the current arrangement of the status widgets - recall by clicking Show Synoptic View
- Select Layout: Brings up a dialog that lets you decide which status widgets to display - see below
- AutoHide: Toggles whether the Status and Command windows always show, or slide out of view when the cursor is not over them. When they are hidden, tabs appear at the edge of the window. Click or hover the mouse over the tab to make the windows slide back into view, and hold your cursor over the window to keep it in view.
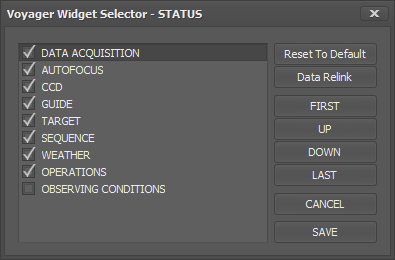
In the Widget Selector window:
- Click a status widget's name to highlight it, then click again to toggle whether it is displayed in the Status window or not. A checkmark appears if it is to be displayed
- Click a widget's name to highlight it, then click the buttons First, Up, Down, or Last to move that status widget's position in the Status window
- Click the Reset to Default button to restore the list of displayed widgets to their default order
- Click the Cancel button to exit the Widget Status selector without making any changes
- Click the Save button to change your chosen Widget Status configuration
Status Widgets
Each of the status widgets contains an "LED" in the upper left corner which gives a quick indication of the status of that component (mount, autofocus, guiding, etc.) of your operation.
- Dark gray means that component is inactive.
- Green means everything is OK
- Yellow means there is a problem but it is not serious (i.e., Voyager will try to correct it automatically)
- Orange means there is a serious problem but Voyager will also try to correct it automatically
- Red means a critical problem, Voyager will abort the operation
Now let's examine each of the available status widgets and see what their display tells us.
Data Acquisition
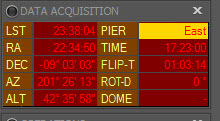
This widget "lights up" when a mount is connected, otherwise it is grayed out. It has the following information:
- LST: Local Sidereal Time
- RA: Mount's current Right Ascension (celestial hour angle)
- DEC: Mount's current Declination
- AZ: Mount's current Azimuth
- ALT: Mount's current Altitude
- PIER: Mount's current orientation - East or West of the pier. East mean mount passed meridian and is flipped. West mean mount is before meridian and not flip done
- TIME: Current local time
- FLIP-T: Elapsed time until meridian flip
- ROT-D: Dome position, if connected
- DOME: actual azimuth of Dome if supported
Operations
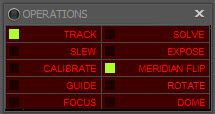
This widget has a status "light" next to various operations that turns on or off (bright colors or dark) when the operation is progressing.
- TRACK: Green when the mount is tracking at sidereal speed, dark gray when it is stopped
- SLEW: Green when the mount is slewing, dark gray when it is stopped
- CALIBRATE: Green when the guide scope software is calibrating, dark gray when it is not
- GUIDE: Green when the guide software is guiding, dark gray when it is not
- FOCUS: Green when an autofocus operation is in progress, blue when it is dithering, dark gray when it is not active
- SOLVE: Green when a plate solve operation is in progress, dark gray when it is not
- EXPOSE: Green when the camera is taking an exposure, orange when it is downloading, dark gray when it is not active
- MERIDIAN FLIP: See table below for status indicators
- ROTATE: Green when the camera rotator is moving, dark gray when it is not
- DOME: Green when the dome shutter is opened, Orange if the dome shutter is closed, blue if Dome have something moving like shutter or azimuth rotating, red if there's an error on dome status reported by the dome external driver, dark gray when dome it is not configured
For all status "light" a red color mean error or misconfiguration.
Meridian Flip Status LED
| Color / Flashing | Meridian Flip LED Meaning |
|---|---|
| Dark Grey | Meridian flip has not yet been done |
| Green | Meridian flip was done successfully |
| Flashing Orange | Scope is pointing beyond meridian and flip will be done at designated minutes past meridian |
| Flashing Blue | Meridian flip in progress |
| Grey | Meridian flip is not managed (it is a user choice for Voyager to manage the meridian flip) |
| Flashing or Solid Red | Meridian management error has occurred |
Autofocus
This widget lights up when an autofocus operation is in progress.
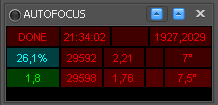
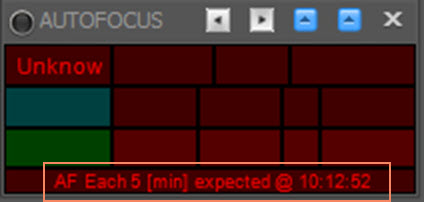
Information displayed includes (from left to right):
- First Row
- Result of the last autofocus operation (DONE or ERROR)
- Time of the last autofocus operation
- Duration of the last autofocus operation
- Position of the star in pixels relative to the image frame used for focus (not valid for RoboFire LocalField autofocus)
- Second Row
- Percentage of change in HFD (Half Flux Diameter) final value from the mean of all autofocus operations in this session (the green value underneath this one) to the last autofocus
- Focuser position at the end of the autofocus operation
- HFD (Half Flux Diameter) obtained by the last autofocus operation
- Empty Field
- Temperature in °C for the last autofocus operation
- Third Row
- HFD (Half Flux Diameter) mean value of all autofocus operations in this session (each sequence starts a new session)
- Focuser position at the end of the previous autofocus operation
- HFD (Half Flux Diameter) obtained by the previous autofocus operation
- Empty Field
- Temperature in °C for the previous autofocus operation
- As of Voyager 2.1.1f, you can specify to run autofocus every X minutes in your sequence. If that option is chosen, the Autofocus status window contains a line showing the time of the next autofocus run:
Also as of Voyager 2.1.1f, the autofocus status window has two panels. Click the grey arrow icons in the title bar to switch between them.
One status window is as documented above.
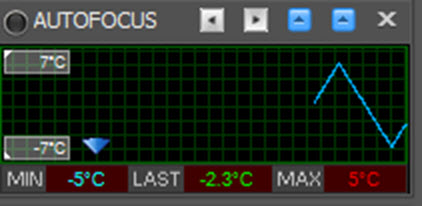
The second status window, shown below, contains the graph of the temperature from the focuser with trend:
- MIN: Lowest temperature reading from the focuser since connecting
- MAX: Highest temperature reading from the focuser since connecting
- LAST: Most recent temperature reading from the focuser
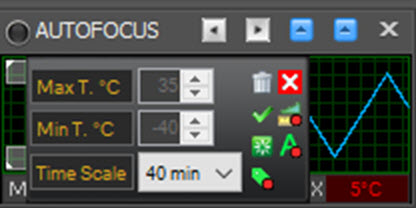
Click this window to bring up a configuration dialog:
From this dialog you can set the temperature scale's Minimum and Maximum values in °C, and the horizontal axis's time scale in minutes.
Hover your mouse pointer over an icon to see a tool-tip explaining what the icon does. The red dot over the icons show the checked status on of the option.
The icons in this pop-up dialog perform the following actions:
There are two blue icons In the autofocus title bar :
- Open RoboFilre VCurve autofocus dashboard
- Open RoboFire Local Field autofocus dashboard
The dashboards will be opened at each focus action and closed automatically after 30 seconds, or the time indicated on the RoboFire Setup window. The dashboard gives realtime data during an autofocus operation, or the last autofocus data if manually opened.
CCD
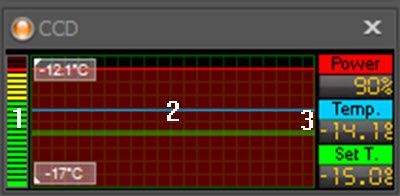
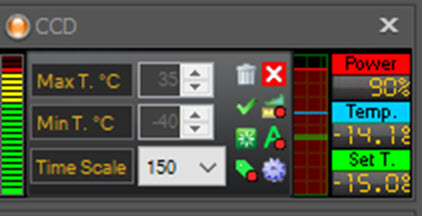
If your CCD or CMOS camera has a cooler, this widget tells us about the sensor temperature.
- This vertical bar indicates the percentage of your CCD cooler's power is in use. It has three colors from green to yellow to red. Green is normal power, yellow is high power, red means nearing or reached maximum power. Consult with your camera's manual to determine what value(s) are acceptable.
- In this area you will find a graph that displays these values as they change over time: Red line - Camera cooler power usage; Blue line: Camera sensor temperature; Green line: Set point temperature - the value you chose as your desired sensor temperature
- Current values of camera sensor cooler power usage, actual sensor temperature, and desired temperature (Set point temperature)
- The two white numbers in rectangles on the left are the minimum and maximum values of the graph's vertical axis.
The LED in the upper left corner indicates cooling status:
- Flashing Green: The camera is cooling
- Solid Green: The camera has reached the set point temperature
- Yellow: There is a problem but Voyager is attempting to resolve it
- Red: There is a critical problem and Voyager cannot resolve it
Right or left click on the CCD status window and you will get this pop-up dialog window:
From this window you can set the temperature scale's Minimum and Maximum values in °C, and the horizontal axis scale's sampling time in seconds. Hover your mouse pointer over an icon to see a tool-tip explaining what the icon does. The red dot over the icons show the checked status on of the option.
The icons in this pop-up dialog perform the following actions:
Guide
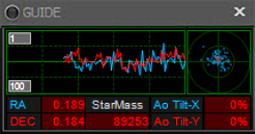
This widget displays information from your guiding software.
- The graph tracks the position of the guide star centroid, as reported by the guiding software, over time. The blue line shows Right Ascension and the red line shows Declination
- The white number label at the upper left is the scale in pixels - e.g., a value of 1 means the graph's vertical scale is +/- 1 pixel, so 2 pixels peak-to-peak
- The white number label at the lower left is the number of samples represented by the graph
- The polar graph on the right shows guiding error values with the center representing zero error, and points in a circle depending on the +/- error value
- The RA value at the bottom of the widget is the RMS (Root Mean Square) guiding error in Right Ascension as reported by your guiding software. Lower numbers are better
- The DEC value at the bottom of the widget is the RMS (Root Mean Square) guiding error in Declination as reported by your guiding software. Lower numbers are better
- Note the RA and DEC values are drawn on the basis of the active sampling scale
- The StarMass value reported by the guiding software
- The Ao Tilt-X and Ao Tilt-Y are the x and y axis tilt values of your Adaptive Optics device, if one is installed and connected
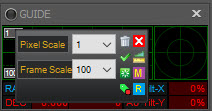
Right or left-clicking on the Guide status window brings up a popup window that lets you make adjustments to the widget. You can change the vertical axis pixel scale, and the horizontal axis sampling scale (Frame scale). Hover your mouse pointer over the icons to get a tool-tip describing what they do, as documented in this table:
Target
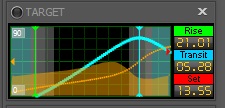
If you have a valid target selected in a currently running sequence, or valid RA and DEC coordinates in the OnTheFly panel, the Target status window will provide the information shown in the list below. If no valid target is selected, the status widget displays "NO VALID DATA" in yellow.
- Displays the altitude of your current target over the course of the night. The areas of the graph with a black background are astronomical night. The areas of the graph with a
blue background are daylight. The areas of the graph with a light gray background are civil twilight, and a dark gray background marks nautical twilight.
- The two numbers in gray boxes at the left of the graph are the altitude values in degrees represented by the bottom and top of the graph
- The cyan graph curve shows the altitude of the target during the timeline of the graph.
- The vertical green line marks the time the target rises
- The vertical cyan line marks the time of the target's transit
- The vertical red line marks the time the target sets
- The vertical orange line marks the target's current altitude
- The dotted orange curved line is the azimuth of target
- The orange filled curved are if present (Horizon enabled) display the horizon limit ralted to the target for the night
- The boxes on the right show the time values indicated by the correspondingly colored vertical lines, for the target's rise, transit, and set
- If any of these values are outside the timescale (horizontal axis) of the chart, a blinking colored arrow appears at the appropriate edge of the chart, pointing in the direction the value would appear if the chart were bigger. E.g., if the setting time of the target is well past sunrise, a red blinking arrow would appear on the right side of the chart, pointing to the right.
Right or left-click on the Target status widget to display a pop-up window which lets you make adjustments to the widget, and tells you the actual times of sunset, astronomical night start and end, and sunrise:
- The values on the left of the chart are as labelled: the actual local time of Sunset and Sunrise, Astronomical Night start and end
The icons in the pop-up window perform the following actions:
Sequence
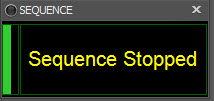
If no sequence is running, the sequence status window displays the yellow text "Sequence Stopped:"
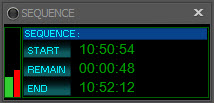
If a sequence is running, the status window displays information about its progress:
- The left section contains two vertical progress bars. The green bar on the left displays progress against the total number of images that will be taken during the sequence. E.g., if your sequence will take five images, after the first one completes, the green bar will be show 1/5th of the total. The green bar is redrawn after each exposure completes.
- The red bar indicates the percentage completed of the current exposure and moves in real time as the exposure progresses.
Weather
If a weather sensor is connected, the weather status window displays the current weather conditions. It also has a status box with values SAFE, SUSPEND or EXIT. The relationship between the weather conditions and the decision to continue, suspend or terminate operations is completely configurable in the Weather portion of the Setup workspace.
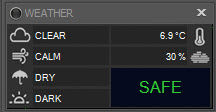
Under SAFE conditions, the weather display may appear similar to this:
The values displayed here are based on readings from the connected weather device. If no weather device is connected, the widget displays the text "OFF."
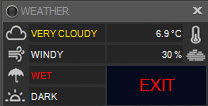
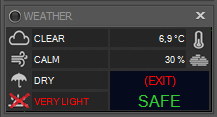
- The first box in the left column with the cloud icon displays cloudiness with possible values: Unknown, Clear, Cloudy, Very Cloudy
- The second box, with the wind icon, shows windiness with possible values: Unknown, Calm, Windy, Very Windy
- The third box, with the umbrella icon, shows whether it is raining, with possible values: Unknown, Dry, Wet, Rain
- The fourth box, with the sun icon, shows how dark it is, with possible values: Unknown, Dark, Light, Very Light
- The first box in the right column shows ambient temperature in degrees C as reported by the connected weather device
- The second box in the right column, with the mist icon, displays the relative humidity as reported by the connected weather device
The text on the lower right is either SAFE, SUSPEND, or EXIT. When weather conditions change, an event can be triggered which will cause the current DragScript or running sequence to be suspended, terminated, or resumed from suspension. See the Weather section in the Setup page for configuration instructions, and the DragScript and Sequence section for how Voyager handles these events.
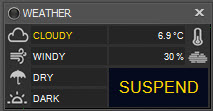
Here's how the status widget may appear if weather conditions occur which, according to the weather setup, would cause operations to pause (be suspended):
If weather conditions occur that would cause operations to terminate, based on the weather configuration, the weather status widget may appear like this
If the Light COnditions is disabled this cause Voyager to ignore the light conditions and calculate the SAFE status without this information, Voyager will evidence this putting a red cross over the light conditions icon and adding to the reporting og the overall status of SAFE conditions a brackets defined safe conditions with all conditions enabled. In the example in next image the LIGHT Conditions are disabled and the final SAFE status is SAFE because the other coditions is on SAFE status. The overall status between brackets take in account also the light conditions and report EXIT cause the Light conditions is Very Light that is configured in the weather table like an exit emergency event:
Observing Conditions
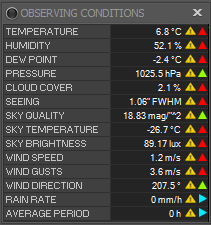
If an Observing Conditions monitor is connected, this widget displays the current observing conditions.
Observing condition trends are monitored and an icon is displayed to the right of the current value depending on the trend. See Observing Conditions Setup for values affecting the trend calcluation.
- Yellow triangle: The number of measurements taken by Voyager is not yet enough to calculate the trend correctly. This depends on the interval chosen in Observing Conditions Setup
- Red arrow up: Trend is increasing (red means the trend is getting worse. For this parameter, an increase is worse)
- Green arrow up: Trend is increasing (green means the trend is improving. For this parameter, an increase is better)
- Red arrow down: Trend is decreasing (red means the trend is getting worse. For this parameter, a decrease is worse)
- Green arrow down: Trend is decreasing (green means the trend is improving. For this parameter, a decrease is better)
- Cyan arrow: The trend is stationary
- Temperature: Temperature in °C
- Humidity: Humidity in percent
- Dew Point: Dew point in °C
- Pressure: Atmospheric pressure in hectoPascals
- Cloud Cover: Percentage of the sky covered by clouds
- Seeing: Seeing measured by the FWHM (Full-Width Half Max) in arc-seconds
- Sky Quality: SQM of local sky measured in magnitudes/arc second squared
- Sky Temperature: Infrared sky temperature measurement - an indicator of cloud coverage but varies with ambient temperature
- Sky Brightness: Sky brightness in lux
- Wind Speed: Wind speed in meters/second
- Wind Direction: Wind direction in decimal degrees
- Rain Rate: Rainfall measured in mm/hour
- Average Period: Moving average time period used in determining trends - is the parameter increasing, decreasing, or staying steady?


